Data-Driven Intelligence for Growth, Impact, and Innovation

Data-driven insights tailored to empower your growth and success, no matter your industry.

Empowering Your Business Through Data Insights

At Biwize Solutions, we specialize in business intelligence, guiding you from inception to a complete model with expert data management and visualization solutions tailored to your needs.

At BiWize Solutions, we specialize in providing high-quality, cost-effective business intelligence and data analysis services for small and medium-sized businesses. From creating dashboards to offering actionable insights, our goal is to help you unlock the power of your data and achieve your goals.

An iPad displaying data visualization content next to a book titled 'Data Science for Business.' The iPad is showing notes and a diagram about dashboard design, accompanied by a stylus placed between the iPad and the book.
Transformative data solutions for your business.

Biwize Solutions

"

Data-Driven Solutions

Empowering businesses with tailored intelligence solutions for effective data management and strategic growth.

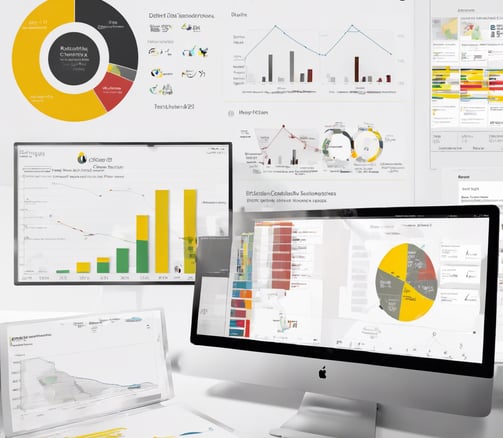
Custom BI Dashboards

Interactive visualizations to make data actionable.

A computer screen displaying a data analytics dashboard with graphs and charts. A blue line graph shows fluctuations in data over time, and a section highlights the number of page views. A pie chart is partially visible, indicating a breakdown of different data elements.
Strategic Insights

Solutions tailored to your unique challenges.

Transform unstructured data into organized, decision-ready formats

Data Organization
A computer screen displaying analytics dashboards with various charts, including a line graph on the left and a cohort analysis table on the right. The table is populated with different shades of blue, indicating varying levels of user activity over several weeks. Text labels and numbers detail user retention statistics.
A laptop with an open screen displaying dashboard analytics featuring charts, graphs, and numerical data related to sales and subscriptions. The interface is predominantly dark-themed with sections highlighting key performance metrics. The device shown is a MacBook Pro, indicated by the keyboard layout and branding.

Biwize Solutions transformed our data management, providing invaluable insights and exceptional visualizations for our growth.

John Doe

A laptop displaying a dashboard with various graphs, charts, and numeric data. The screen is partially visible, showcasing sections with line graphs, financial figures, and small images. The background is blurred with a prominent red light creating a warm ambiance.
A digital screen displaying analytical data with line graphs, histograms, and numerical values. The data is presented in a user-friendly interface with different shades of blue used to distinguish various elements.

★★★★★

Get in Touch with Us

Reach out for tailored business intelligence and data management solutions.

A promotional banner with a bold red background features the text 'Data has a better idea' in large white letters. Above the text, the word 'HIVERY' is printed along with a stylized logo resembling a beehive. The background also includes a pattern of blue circles and dots, giving a digital or technological feel. In the surrounding area, there's a partial view of a desk and some office supplies.